Table of Contents
Introduction
CloudWatch Logs is a service that can become quite costly if not managed properly. Unlike many AWS services where storage dominates the bill, with CloudWatch Logs it’s typically ingestion that drives the cost.
The good news: In most cases you can keep CloudWatch Logs costs under control with very little effort, or at least pinpoint the cost drivers quickly. This blog post helps you achieve that goal.
Scope: This post focuses exclusively on CloudWatch Logs. It does not cover CloudWatch Metrics, Alarms, Dashboards, or other CloudWatch features - each of those has its own pricing model and optimization strategies.
Understanding CloudWatch Logs pricing
CloudWatch Logs has three main cost components:
| Component | What you pay for | Typical impact |
|---|---|---|
| Ingestion | Data written to CloudWatch Logs | Primary cost driver |
| Storage | Data retained in log groups | Usually minor |
| Analysis | Logs Insights queries, Live Tail | Variable |
First aid: Ingestion
Some AWS services like DMS (Database Migration Service) and many application logs can be extremely verbose. Ask yourself: Do we really need to log every processed item in a loop with 10,000 iterations? Most likely the answer is no.
Common issues that drive up ingestion costs:
- Wrong log level in code: Developers write DEBUG or TRACE level logs that should never reach production
- Wrong log level configuration: The application’s logging framework is set to DEBUG instead of INFO or WARN in production environments
- Overly verbose libraries: Third-party SDKs or frameworks logging every HTTP request/response in full detail
A quick way to identify verbose log patterns is using CloudWatch Logs Insights. Simply open the log group and click the “Compare patterns over time” button - it will show you which log patterns contribute most to your volume.
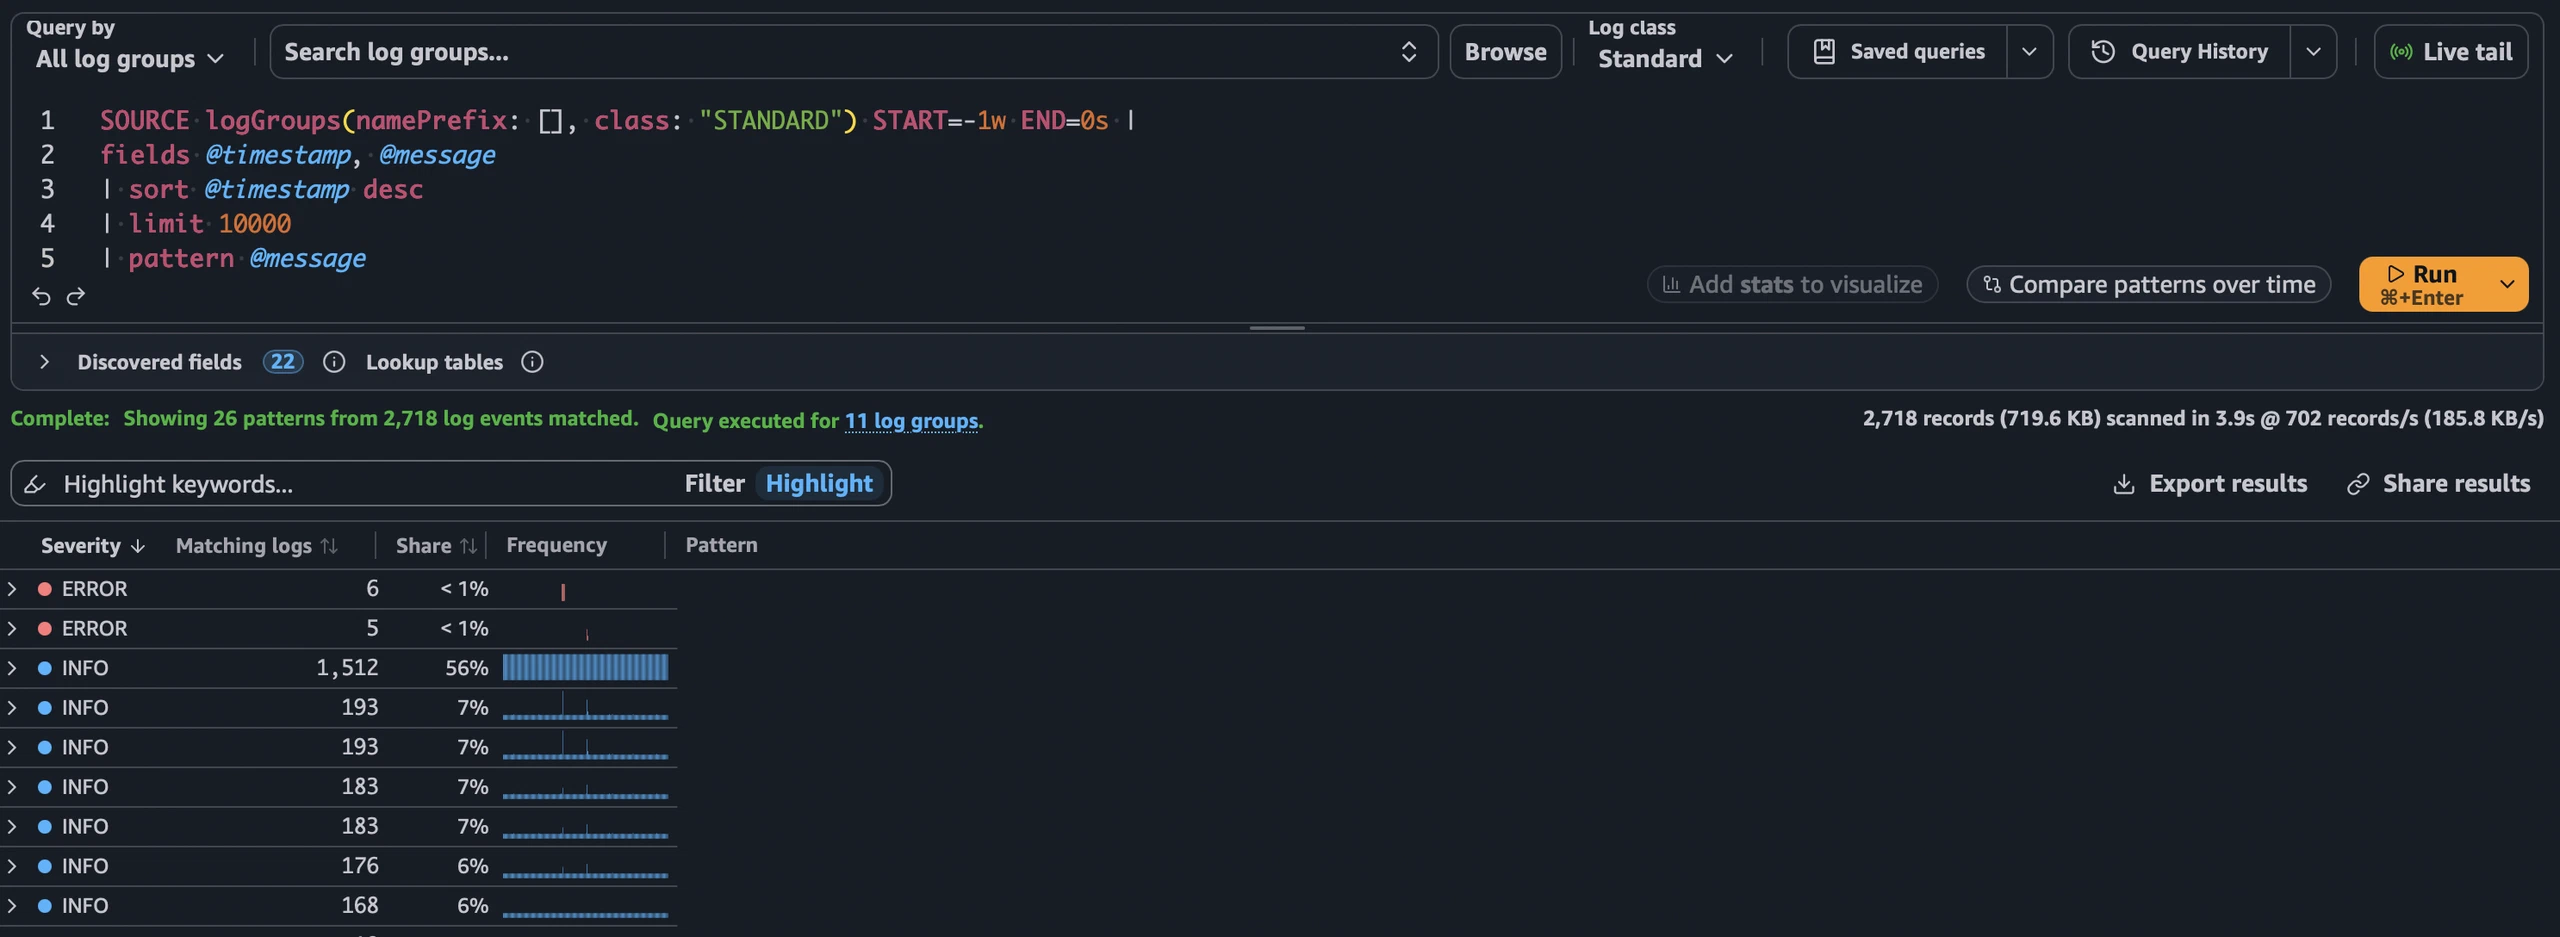
Additionally, consider using the Infrequent Access (IA) log class for your application logs. If your logs aren’t further processed (no subscription filters, no metric filters) and you can live with a 1-2 minute delay when viewing logs, IA is a solid choice. The biggest drawback is that you need to use CloudWatch Logs Insights to query logs - there’s no live tail view available.
Note on Log Classes: CloudWatch Logs offers two log classes - Standard and Infrequent Access (IA). The IA class has lower ingestion costs but reduced features. Important caveat: You cannot switch an existing log group between classes. To move logs to IA, you must recreate the log group entirely.
⚠️ Warning for Lambda and vended logs: While IA sounds attractive, using it for Lambda logs or vended logs in larger enterprises may actually increase costs due to how volume pricing works. We’ll explore this trap in detail in the Infrequent Access tier trap section below.
First aid: Storage
Intelligent Tiering can be activated at the account level and comes with no drawbacks - it’s fully managed and makes automated choices about moving older logs to cheaper storage tiers.
However, if you’re retaining logs for less than 30 days or frequently analyzing logs, Intelligent Tiering won’t add value since your logs will stay in the standard storage tier anyway.
Vended logs vs standard logs
This is a crucial distinction for understanding your CloudWatch Logs bill.
Vended logs
Vended logs are logs that AWS services publish to CloudWatch on your behalf. The most common (and often noisiest) examples include:
- VPC Flow Logs
- EKS Control Plane logs (audit, authenticator, etc.)
- Route 53 Resolver query logs
- AWS WAF logs
- Amazon MSK broker logs
- AWS Lambda logs (as of May 2025)
Note: This list is not complete - AWS continues to add services to vended log pricing. Check the CloudWatch pricing page for the current list.
Vended logs have volume-tiered pricing with significant discounts at scale:
| Volume (per month) | Standard class | IA class | Discount vs Tier 1 |
|---|---|---|---|
| First 10 TB | $0.63/GB | $0.285/GB | Base rate |
| 10 - 30 TB | $0.315/GB | $0.171/GB | 50% off |
| 30 - 50 TB | $0.126/GB | $0.086/GB | 80% off |
| Over 50 TB | $0.063/GB | $0.057/GB | 90% off |
Prices shown for eu-central-1. Check CloudWatch pricing for your region.
This tiered pricing means your effective per-GB cost drops significantly at scale - a welcome discount for large environments.
Standard logs (application logs)
Standard logs are everything else: your application logs, EC2 instance logs via CloudWatch Agent, and any custom logs you send.
How to locate cost drivers
Start with Cost Explorer
Before diving into Athena queries, start with Cost Explorer to identify the general pattern:
Step 1: Filter by usage type
Group by Usage Type and filter for CloudWatch. Look for:
{region}-DataProcessing-Bytes- Standard log ingestion{region}-DataProcessingIA-Bytes- IA log ingestion{region}-VendedLog-Bytes- Vended log ingestion (Standard class){region}-VendedLogIA-Bytes- Vended log ingestion (IA class){region}-VendedLog-Bytes-WAFLogs- WAF log ingestion{region}-TimedStorage-ByteHrs- Log storage (Standard tier){region}-TimedStorage-IA-ByteHrs- Log storage (Infrequent Access tier, from Intelligent Tiering)
In most environments, VendedLog-Bytes and DataProcessing-Bytes dominate.
Tip: If you filter by a specific usage type (or multiple types with the same unit like GB), Cost Explorer will also show you the volume - for example, how many GB were ingested or stored. This helps you understand both cost and consumption patterns.
Step 2: Identify the cost driver
This is the crucial part. At this point you can see the cost driver category, but you cannot pinpoint it to a specific log group. You now know whether it’s your own application logging or vended logging - but which log group exactly?
To get resource-level insights you have two options:
- Cost Explorer with resource-level data (free): Enable resource-level granularity in Cost Explorer settings. Limitation: only 14 days lookback.
- CUR2 with Athena: Query your Cost and Usage Report with hourly granularity and full resource-level details. No time limitation.
Deep dive with Athena on CUR2
To pinpoint which log groups drive your CloudWatch Logs cost, you’ll need to query your Cost and Usage Report (CUR2) data via Athena.
Prerequisites
- CUR2 enabled with resource IDs
- Athena configured to query your CUR bucket
Query: Cost by log group with breakdown by type
This query shows your top log groups with volume (GB) and cost breakdown by type:
SELECT
    line_item_resource_id as log_group,
    product_region_code as region,

    -- Standard log ingestion
    ROUND(SUM(CASE WHEN line_item_usage_type LIKE '%DataProcessing-Bytes'
             AND line_item_usage_type NOT LIKE '%IA%'
        THEN line_item_usage_amount ELSE 0 END), 2) as standard_ingest_gb,
    ROUND(SUM(CASE WHEN line_item_usage_type LIKE '%DataProcessing-Bytes'
             AND line_item_usage_type NOT LIKE '%IA%'
        THEN line_item_unblended_cost ELSE 0 END), 2) as standard_ingest_usd,

    -- IA log ingestion
    ROUND(SUM(CASE WHEN line_item_usage_type LIKE '%DataProcessingIA%'
        THEN line_item_usage_amount ELSE 0 END), 2) as ia_ingest_gb,
    ROUND(SUM(CASE WHEN line_item_usage_type LIKE '%DataProcessingIA%'
        THEN line_item_unblended_cost ELSE 0 END), 2) as ia_ingest_usd,

    -- Vended logs (Standard)
    ROUND(SUM(CASE WHEN line_item_usage_type LIKE '%VendedLog-Bytes'
             AND line_item_usage_type NOT LIKE '%IA%'
             AND line_item_usage_type NOT LIKE '%WAF%'
        THEN line_item_usage_amount ELSE 0 END), 2) as vended_standard_ingest_gb,
    ROUND(SUM(CASE WHEN line_item_usage_type LIKE '%VendedLog-Bytes'
             AND line_item_usage_type NOT LIKE '%IA%'
             AND line_item_usage_type NOT LIKE '%WAF%'
        THEN line_item_unblended_cost ELSE 0 END), 2) as vended_standard_ingest_usd,

    -- Vended logs (IA)
    ROUND(SUM(CASE WHEN line_item_usage_type LIKE '%VendedLogIA%'
        THEN line_item_usage_amount ELSE 0 END), 2) as vended_ia_ingest_gb,
    ROUND(SUM(CASE WHEN line_item_usage_type LIKE '%VendedLogIA%'
        THEN line_item_unblended_cost ELSE 0 END), 2) as vended_ia_ingest_usd,

    -- Storage
    ROUND(SUM(CASE WHEN line_item_usage_type LIKE '%TimedStorage%'
        THEN line_item_usage_amount ELSE 0 END), 2) as storage_gb,
    ROUND(SUM(CASE WHEN line_item_usage_type LIKE '%TimedStorage%'
        THEN line_item_unblended_cost ELSE 0 END), 2) as storage_usd,

    -- Totals
    ROUND(SUM(line_item_usage_amount), 2) as total_gb,
    ROUND(SUM(line_item_unblended_cost), 2) as total_cost_usd
FROM
    your_cur_table
WHERE
    line_item_product_code = 'AmazonCloudWatch'
    AND (line_item_usage_type LIKE '%DataProcessing%'
         OR line_item_usage_type LIKE '%VendedLog%'
         OR line_item_usage_type LIKE '%TimedStorage%')
    AND line_item_usage_type NOT LIKE '%WAF%'
    AND line_item_resource_id IS NOT NULL
    AND line_item_usage_account_id = '123456789012'  -- Replace with your account ID
    AND billing_period = '2026-08'                   -- Replace with desired month
GROUP BY
    line_item_resource_id,
    product_region_code
ORDER BY
    total_cost_usd DESC
LIMIT 50;
Note: The
line_item_usage_amountfor CloudWatch Logs is already reported in GB, so no conversion is needed.
The Infrequent Access tier trap
AWS introduced an Infrequent Access (IA) tier for CloudWatch Logs, marketed as 50% cheaper. Sounds great, right? Not so fast.
The pricing reality
The IA tier pricing also has volume tiers - and here’s the catch:
| Volume | Standard tier | IA tier | IA savings |
|---|---|---|---|
| First 10 TB | $0.63/GB | $0.285/GB | ~55% |
| 10-30 TB | $0.315/GB | $0.171/GB | ~46% |
| 30-50 TB | $0.126/GB | $0.086/GB | ~32% |
| Over 50 TB | $0.063/GB | $0.057/GB | ~10% |
Prices shown for eu-central-1.
At high volumes, the standard tier’s aggressive volume discounts mean IA provides almost no benefit.
When IA makes sense
IA is only cost-effective when:
- Your total log volume stays in Tier 1 (< 10 TB/month)
- You rarely query the logs (IA has higher query costs)
For mid-to-large enterprises logging 50+ TB/month, standard tier is often cheaper.
Interactive cost calculator
To help you decide between Standard and IA tiers, use the calculator below. Adjust your daily ingestion volume and the Standard/IA split to see how costs change over a month.
Interactive Cost Calculator
Adjust the sliders to see how different scenarios affect your CloudWatch Logs cost.
Pricing snapshot as of August 2026. Check current AWS pricing for accuracy.
Tier Progression
Cumulative Cost Comparison
Savings: Positive = Mixed cheaper, Negative = All Standard cheaper
Wrap up
Understanding your CloudWatch Logs cost footprint is essential for effective cost management. Cost Explorer helps you identify the major cost drivers at a glance, while CUR2 with Athena allows you to pinpoint specific log groups causing issues.
Tip: When analyzing costs in Cost Explorer, filter by specific usage types to see the impact of volume pricing tiers. This gives you visibility into both cost and consumption patterns.
The Infrequent Access (IA) log class for vended logs can be a dangerous trap for mid-sized and large enterprises. What looks like a 50% savings in Tier 1 shrinks to just 10% at high volumes - and if you’re splitting traffic between Standard and IA, you may actually end up paying more because neither stream reaches the lower pricing tiers as quickly.
Use the calculator above to get a feel for how different scenarios affect your costs. In many cases, keeping everything in Standard class and benefiting from the aggressive volume discounts is the better choice.